Publications » Archive » European Steel in Figures 2020
European Steel in Figures 2020
Downloads and links
Recent updates
European Steel in Figures 2020 is the European Steel Association’s (EUROFER) statistical guide. It shows a sector that has experienced a challenging year in 2019, with employment levels stable but demand beginning to fall off. In 2019, imports fell from the record rise seen in 2018 - in line with falling demand. The decline in production and demand will have an impact on future employment figures, as will the impact of the COVID-19 outbreak. Total employment – jobs directly or indirectly, or induced by the sector – now stands at 2.6 million. Total Gross Value Added is €140 billion.
This new European Steel in Figures 2020 guide updates the trade map, showing imports and exports from the EU in an easy-to-understand way, breaking down previously hard to read figures. Additionally, the sustainability section of the guide has been doubled in size and updated with the latest data, now including refreshed information on slag production by the steel industry and its use by other downstream sectors.
All these statistics help give an overview of the European steel industry today. Awareness of the employment, production, demand and trade challenges that face the sector ensure a greater understanding of our strategically important sector. With this in mind, I hope you enjoy using European Steel in Figures 2020.
Download this publication or visit associated links
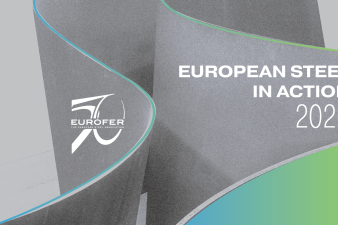
Steel in Action 2026
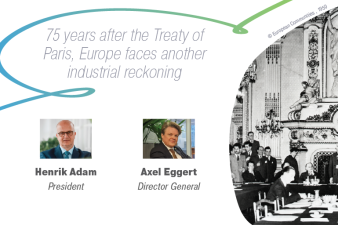
Brussels, 12 June 2026 - Europe's steel industry has noted improvements made by EU ministers to the proposed reform of the Carbon Border Adjustment Mechanism (CBAM), but warns loopholes remain that could weaken both Europe's climate ambitions and industrial competitiveness.
EUROFER’s Annual Report 2026 sets out the key economic trends, policy developments and challenges shaping the future of the European steel industry today.
The European Steel Association (EUROFER)
172 Avenue de Cortenbergh
1000 Brussels
Belgium
Email: mail@eurofer.eu
Phone: +32 (0) 2 738 79 20