Publications » Brochures, booklets or fact-sheets » European Steel in Figures 2021
European Steel in Figures 2021
Downloads and links
Recent updates
European Steel in Figures 2020 is the European Steel Association’s (EUROFER) statistical guide. It shows a sector that has experienced a challenging year in 2020, with employment levels having fallen and demand collapsing, largely as a result of the COVID-19 outbreak. In 2020, imports fell further, continuing the trend seen in 2019 but again, largely due to the drop in domestic demand brought on by the pandemic.
This new European Steel in Figures 2021 guide updates the trade map, showing imports and exports from the EU in an easy-to-understand way, breaking down previously hard to read figures. Additionally, the sustainability section of the guide has been updated with the latest 2020 data, now including refreshed information on slag production by the steel industry and its use by other downstream sectors.
All these statistics help give an overview of the European steel industry today. Awareness of the employment, production, demand and trade challenges that face the sector ensure a greater understanding of our strategically important sector. With this in mind, I hope you enjoy using European Steel in Figures 2021.
Download this publication or visit associated links
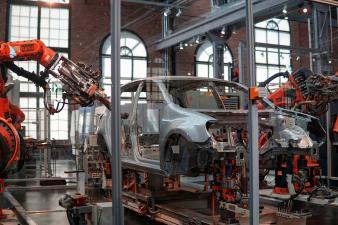
Proposed credit would allow European carmakers to meet 3% of their CO₂ targets through low-carbon steel made in the EU rising to 7.5% from 2035.
Brussels, 21 October 2026 - The European steel industry welcomes a compromise reached in the European Parliament yesterday on CO₂ standards for cars and vans, which includes a dedicated incentive for carmakers to use low-carbon steel Made in the EU.
As EU steel production rises, helping preserve up to 80,000 jobs, the industry reports €3.4 billion in investment decisions, with a further €2.4 billion expected by year-end.
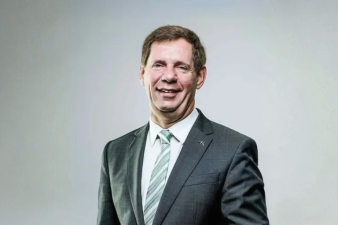
Brussels, 1 October 2026 - The European Steel Association (EUROFER) has elected Geert Van Poelvoorde, Chairman of the Board of ArcelorMittal Europe Steel, as its new President. Taking office today, Mr Van Poelvoorde said stronger home markets across the steel value chain, secure access to export markets and a strong industrial base will be essential to delivering on the European Union’s ambitions for global competitiveness and strategic autonomy.
The European Steel Association (EUROFER)
172 Avenue de Cortenbergh
1000 Brussels
Belgium
Email: mail@eurofer.eu
Phone: +32 (0) 2 738 79 20